Best Free AI Infographic Makers in 2026: 15+ Tools to Create Visual Content
Free AI infographic makers can help you transform complex information, statistics, research, and ideas into visual content that is easier to understand. Instead of designing every element manually, you can use AI-assisted tools to organize information, suggest layouts, generate graphics, and create a first draft of an infographic.
Infographics are useful for blog articles, social media posts, educational materials, business reports, presentations, and marketing campaigns. Some tools focus on graphic design, while others specialize in charts, diagrams, data visualization, or turning text into visual summaries.
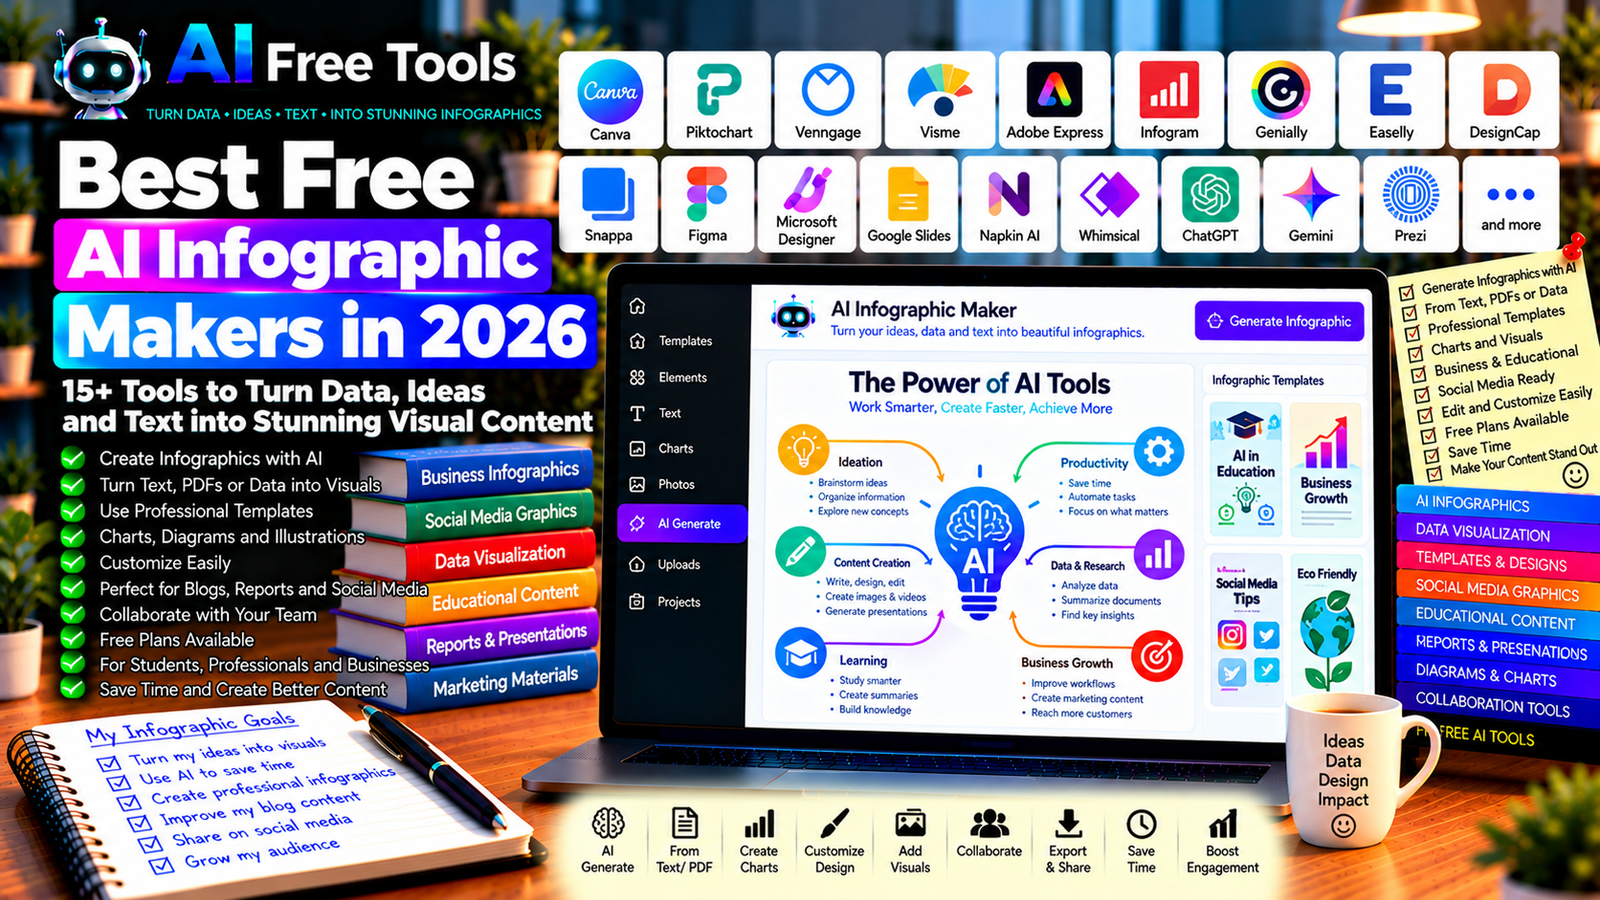
In this guide, we compare 17 design platforms and AI-assisted tools in 2026. You will learn what each tool is best for, which free features to investigate, and how to choose the right solution for your projects.
Important: Not every tool listed here automatically generates complete infographics with AI in its free plan. Some provide free design templates or charts, while AI generation, premium assets, downloads, and advanced features may have restrictions. Check current plan details before starting a large project.
Quick Comparison: Best Free AI Infographic Makers
| Tool | Best For | Free Access |
|---|---|---|
| Canva | General-purpose infographic design | Free plan; AI features have limits |
| Piktochart | Business and educational infographics | Free plan with restrictions |
| Venngage | Reports and professional infographics | Free access with limitations |
| Visme | Infographics and data visualization | Free plan with restrictions |
| Adobe Express | Visual content and branded graphics | Free features; AI limits may apply |
| Infogram | Charts and data-driven visuals | Free plan with restrictions |
| Genially | Interactive visual content | Free access with limits |
| Easelly | Traditional infographic templates | Free access and features vary |
| DesignCap | Simple infographic design | Free features with restrictions |
| Snappa | Social graphics and visual content | Free plan with limits |
| Figma | Custom infographic layouts | Free access with limits |
| Microsoft Designer | AI-assisted visual design | Availability and usage may vary |
| Google Slides | Simple diagrams and visual reports | Core features generally free |
| Napkin AI | Turning text into visual diagrams | Free access with limits |
| Whimsical | Diagrams and visual explanations | Free plan with limits |
| ChatGPT | Planning infographic content | Free tier with limits |
| Google Gemini | Outlines, summaries, and visual content ideas | Free tier with limits |
1. Canva — Best for General-Purpose Infographics
Canva is a visual design platform with templates for infographics, presentations, social media graphics, posters, and reports. Its templates and drag-and-drop editor make it accessible to beginners.
AI-assisted design and writing features can help you brainstorm content, create visual elements, or develop a first draft, depending on your account and current plan.
Best features:
- Start with infographic templates.
- Customize colors, typography, icons, and illustrations.
- Add charts and data visualizations.
- Resize designs for different platforms.
- Explore AI-assisted writing and design features.
Free access: Canva offers a free plan. Some templates, stock assets, premium design features, and AI usage may require a paid subscription.
Best for: Bloggers, marketers, students, teachers, and small businesses.
Official website: https://www.canva.com/
2. Piktochart — Best for Business and Educational Infographics
Piktochart focuses on visual communication, including infographics, reports, presentations, and charts. It is useful when you want to present information in a structured, professional format.
Best features to investigate:
- Create infographics from templates.
- Organize information into visual sections.
- Build reports and presentations.
- Use charts to communicate data.
- Explore AI-assisted content or design features where available.
Free access: Piktochart offers free access with restrictions that may include project limits, downloads, branding, or advanced features.
Best for: Teachers, business professionals, researchers, and content creators.
Official website: https://piktochart.com/
3. Venngage — Best for Professional Reports
Venngage provides design tools for infographics, reports, process diagrams, and other business visuals. It can help turn information into a consistent visual format without requiring advanced graphic design skills.
Best features to investigate:
- Create infographic layouts.
- Use templates for reports and processes.
- Present statistics visually.
- Maintain consistent colors and typography.
- Explore available AI-assisted design features.
Free access: Venngage offers access options with restrictions. Export formats, branding removal, and collaboration features may require a paid plan.
Best for: Business teams, educators, consultants, and organizations creating reports.
Official website: https://venngage.com/
4. Visme — Best for Infographics and Data Visualization
Visme is a visual content platform for infographics, presentations, reports, and data-driven graphics. It can be useful when your design includes charts, diagrams, statistics, and explanatory text.
Best features:
- Create infographics and reports.
- Add charts and diagrams.
- Customize templates and visual elements.
- Build presentations from visual content.
- Explore available AI-assisted tools.
Free access: Visme offers a free plan with restrictions on projects, assets, downloads, and advanced features.
Best for: Marketers, educators, consultants, and business teams.
Official website: https://www.visme.co/
5. Adobe Express — Best for Branded Visual Content
Adobe Express helps users create social media graphics, posters, flyers, and other visual materials. It can also be used to design infographic-style content from templates and custom layouts.
Its AI-assisted capabilities may help generate or edit visual assets, depending on the account and current plan.
Best features:
- Create graphics from templates.
- Customize brand colors and typography.
- Combine text, icons, and images.
- Resize designs for different platforms.
- Explore eligible generative AI features.
Free access: Adobe Express offers free features, but premium assets, advanced tools, and generative AI usage may have restrictions.
Best for: Marketers, small businesses, content creators, and users working with Adobe products.
Official website: https://www.adobe.com/express/
6. Infogram — Best for Data-Driven Infographics
Infogram specializes in charts, maps, dashboards, and data visualization. It is a strong option when your infographic needs to explain numerical information rather than simply display illustrations and text.
Best features to investigate:
- Create charts and graphs.
- Present statistics visually.
- Build reports and dashboards.
- Explore maps and supported visualizations.
- Share visual content through available options.
Free access: Infogram offers free access with restrictions that may include project limits, branding, or privacy settings. Check the current plan for export and sharing requirements.
Best for: Analysts, journalists, educators, marketers, and businesses presenting data.
Official website: https://infogram.com/
7. Genially — Best for Interactive Infographics
Genially is a visual content platform for interactive presentations, infographics, educational materials, and other digital experiences.
It can be useful when you want readers to click on elements, explore additional information, or interact with the content rather than simply view a static image.
Best features:
- Create interactive infographics.
- Add clickable elements and animations.
- Build educational visuals.
- Create presentations and visual explainers.
- Share projects online through supported options.
Free access: Genially offers free access with restrictions. Advanced features, downloads, and privacy controls may depend on the current plan.
Best for: Teachers, trainers, marketers, and content creators.
Official website: https://genially.com/
8. Easelly — Best for Template-Based Infographics
Easelly focuses on creating infographics with templates and visual elements. It can be useful when you want to communicate a process, explain a concept, or summarize information without starting from a blank page.
Best features to investigate:
- Use infographic templates.
- Arrange text and visual elements.
- Explain processes and concepts.
- Customize layouts for different audiences.
- Check available export options.
Free access: Access conditions and available templates may vary. Verify current free features and download restrictions before starting your project.
Best for: Students, teachers, small businesses, and users who prefer template-based design.
Official website: https://www.easel.ly/
9. DesignCap — Best for Simple Infographic Design
DesignCap provides online graphic design tools and templates that can help users create infographics, posters, and other visual materials.
It is more focused on designing and arranging visual elements than on fully automated AI generation.
Best features to investigate:
- Start with infographic templates.
- Customize text, shapes, and images.
- Organize information visually.
- Create related promotional graphics.
- Check supported export formats.
Free access: DesignCap offers access options with potential restrictions on downloads, templates, and advanced features. Check current pricing before committing.
Best for: Beginners, students, and users who need simple visual designs.
Official website: https://www.designcap.com/
10. Snappa — Best for Social Media Graphics
Snappa is an online design tool for social media images, blog graphics, advertisements, and other visual content. Although it is not a dedicated AI infographic generator, it can help create compact infographic-style graphics for online publishing.
Best features:
- Use pre-designed layouts.
- Create graphics for social media.
- Customize typography and colors.
- Add visual assets to explain simple concepts.
- Prepare images for blogs and online campaigns.
Free access: Snappa offers free access with restrictions that may include monthly downloads or available features.
Best for: Bloggers, marketers, freelancers, and social media managers.
Official website: https://snappa.com/
11. Figma — Best for Custom Infographic Layouts
Figma is a collaborative design platform used for interfaces, diagrams, and custom visual layouts. It is useful when you want precise control over alignment, spacing, typography, and reusable design components.
It is not primarily a one-click infographic generator, but designers can build reusable infographic templates and explore community resources or supported plugins.
Best features:
- Design custom infographic layouts.
- Align elements precisely.
- Reuse components and styles.
- Collaborate on designs.
- Explore supported plugins and templates.
Free access: Figma offers free access options, although file, collaboration, and advanced feature limits may vary.
Best for: Designers, product teams, and users who want more control over the final layout.
Official website: https://www.figma.com/
12. Microsoft Designer — Best for AI-Assisted Visual Design
Microsoft Designer provides AI-assisted design workflows for creating visual content. Depending on current features and account eligibility, it may help generate images or design assets that can be used in infographic-style content.
It may be more suitable for creating visual components than for automatically producing a complex, data-accurate infographic.
Best features to investigate:
- Generate visual concepts from prompts.
- Create graphics for online publishing.
- Explore supported editing tools.
- Develop visual assets for infographic layouts.
- Check current export and usage limits.
Free access: Availability, AI credits, and feature limits may change. Verify the current offer and account requirements.
Best for: Beginners, marketers, and users who want AI-assisted visual assets.
Official website: https://designer.microsoft.com/
13. Google Slides — Best for Simple Infographics and Reports
Google Slides is a presentation editor that can be used to create simple infographics, process diagrams, timelines, and visual summaries. It provides more manual control than a dedicated AI generator, but it is useful for basic designs.
You can use ChatGPT or Gemini to plan the content and then arrange it in Slides.
Best features:
- Create diagrams using shapes and connectors.
- Arrange information in visual sections.
- Collaborate online.
- Add charts and images.
- Export or share content through supported options.
Free access: Core Google Slides features are generally free with a Google account. Some AI capabilities depend on the current account and plan.
Best for: Students, teachers, small businesses, and teams creating simple visuals.
Official website: https://slides.google.com/
14. Napkin AI — Best for Turning Text into Visual Explanations
Napkin AI focuses on turning written ideas into visual elements such as diagrams and explanatory graphics. It can be useful when you have a paragraph or concept and want a visual representation to support it.
Best features to investigate:
- Convert text into visual diagrams.
- Explore alternative visual layouts.
- Create process illustrations.
- Use visuals in documents and presentations.
- Export graphics through available options.
Free access: Napkin AI offers access options with usage restrictions that may include AI credits or export limits. Check current terms before producing a large batch of graphics.
Best for: Bloggers, educators, consultants, and professionals who need visual explanations.
Official website: https://www.napkin.ai/
15. Whimsical — Best for Diagrams and Visual Explanations
Whimsical provides tools for mind maps, flowcharts, diagrams, and other visual planning materials. It can help organize information into a clear structure before you turn it into a finished infographic.
Best features:
- Create flowcharts and mind maps.
- Organize information visually.
- Build process explanations.
- Collaborate on diagrams.
- Explore available AI-assisted features.
Free access: Whimsical offers a free plan with restrictions on items, AI usage, and advanced collaboration.
Best for: Product teams, content creators, students, and professionals explaining processes.
Official website: https://whimsical.com/
16. ChatGPT — Best for Planning Infographic Content
ChatGPT can help you determine what an infographic should communicate before you start designing it. You can ask it to summarize a subject, organize statistics into sections, write short labels, or prepare a content hierarchy.
It does not replace a dedicated design editor in every workflow, but it can save time when preparing the information that goes into the infographic.
Best features:
- Summarize long content into key points.
- Create infographic outlines.
- Suggest headings and short captions.
- Organize verified data into sections.
- Draft calls to action and explanatory text.
Free access: ChatGPT offers a free tier with usage and feature limits.
Best for: Bloggers, marketers, students, educators, and business owners.
Official website: https://chatgpt.com/
Example prompt:
“Create the content plan for a one-page infographic about [TOPIC]. Include a clear headline, a short introduction, five main sections, concise captions, and a final takeaway. Use only the information provided below. Do not invent statistics. Identify any claims that need verification and suggest a suitable chart or visual for each section.”
17. Google Gemini — Best for Outlines and Visual Content Ideas
Google Gemini can help summarize material, organize ideas, and develop a content plan for an infographic. You can use it to create concise text for different sections and suggest ways to explain a subject visually.
Best features:
- Summarize supported information.
- Organize content into sections.
- Suggest charts and visual concepts.
- Draft concise captions.
- Support eligible Google Workspace workflows.
Free access: Gemini offers a free tier with usage limits. Advanced features and file handling depend on the current account and plan.
Best for: Students, educators, marketers, and professionals preparing visual content.
Official website: https://gemini.google.com/
How to Choose the Best Free AI Infographic Maker
The right tool depends on the kind of infographic you want to create and the amount of design control you need.
| Your Main Goal | Recommended Starting Tools |
|---|---|
| Create a general infographic | Canva |
| Produce a professional report | Piktochart or Venngage |
| Visualize statistics and charts | Infogram or Visme |
| Create interactive visuals | Genially |
| Turn text into a diagram | Napkin AI |
| Create social media graphics | Canva, Adobe Express, or Snappa |
| Design a custom layout | Figma |
| Plan infographic content with AI | ChatGPT or Gemini |
| Create a simple process diagram | Whimsical or Google Slides |
Best Free AI Infographic Makers for Bloggers
Bloggers can use infographics to explain complicated topics, summarize research, and provide visual resources that readers may find useful.
Canva and Visme are practical starting points for general designs, while Piktochart can help with information-heavy content. Napkin AI may be useful for creating a diagram from a written explanation.
Before publishing, make sure that the infographic supports the article rather than simply repeating it. Use readable text, cite data sources, and add a descriptive image filename and alternative text.
Best AI Infographic Makers for Business
Businesses can use infographics to present performance metrics, explain services, summarize reports, and communicate processes to customers or employees.
Piktochart, Visme, and Venngage are worth exploring for reports and structured visual content. Infogram may be more suitable when the main purpose is to communicate data.
Check all figures and labels against the original data. A visually polished infographic can still be misleading if the underlying numbers are wrong or presented without context.
Best Infographic Tools for Social Media
Social media infographics need to be readable on small screens. Canva, Adobe Express, and Snappa can help create compact designs that fit different publishing formats.
Keep the main message prominent, use short captions, and avoid placing too much information in a single image. Consider creating separate versions for vertical, square, and horizontal formats rather than simply shrinking one design.
How to Create an AI Infographic in Five Steps
Step 1: Choose One Clear Message
Decide what the reader should learn from the infographic. A focused topic is easier to explain visually than a broad subject with too many unrelated points.
Step 2: Prepare Reliable Information
Collect the facts, figures, and explanations you want to include. Use trustworthy sources and record where important statistics came from.
Step 3: Ask AI to Organize the Content
Request a short headline, a logical sequence of sections, concise captions, and suggestions for charts or diagrams. Avoid asking the AI to invent statistics simply to make the infographic look more impressive.
Step 4: Design the Visual Layout
Use a template or design editor to arrange the content. Establish a clear reading order, use consistent typography, and maintain enough space between elements.
Step 5: Verify and Export
Check spelling, figures, labels, and source references. Preview the design at its intended size, confirm that the text is readable, and export it in a suitable format.
Example AI Prompt for an Infographic
Copy and adapt this prompt:
“Prepare a one-page infographic about [TOPIC] for [TARGET AUDIENCE]. Include one strong headline, a brief introduction, 5–7 sections, concise captions, and a final takeaway. Suggest a visual for each section and indicate where a chart would be useful. Use only the verified information provided below. Do not invent statistics or sources. Keep the wording short enough to read comfortably on a mobile screen.”
Are Free AI Infographic Makers Worth Using?
Yes. They can reduce the time required to organize information, select a layout, and create visual content for blogs, reports, presentations, and social media.
For general-purpose design, start with Canva. For data-rich infographics, explore Piktochart, Visme, or Infogram. For interactive visuals, investigate Genially. For diagrams generated from text, consider Napkin AI. ChatGPT and Gemini can help plan the content before you move to a design tool.
However, AI-generated visuals should always be reviewed. Check data accuracy, readability, source attribution, image licensing, and the overall message before publishing.
Are AI Infographic Makers Safe for Business Data?
Infographics may contain internal figures, customer information, financial results, or confidential plans. Some platforms process prompts and uploaded documents using cloud-based services.
Before uploading sensitive information, review the provider’s privacy policy, data-retention terms, and access controls. Use an approved tool for confidential projects, and remove personal information that is not necessary for the design.
Frequently Asked Questions
What is the best free AI infographic maker in 2026?
The best choice depends on the project. Canva is a useful general-purpose design tool, Piktochart and Visme are worth exploring for structured infographics, Infogram is focused on data visualization, and Napkin AI can help turn text into diagrams. Check current free-plan limits before choosing.
Can AI create a complete infographic from text?
Some tools offer AI-assisted design or text-to-visual workflows, while others help only with specific diagrams or content sections. You may still need to adjust the layout, correct the wording, and verify the data manually.
Are free AI infographic makers really free?
Many provide free plans, but premium templates, AI credits, exports, branding removal, and collaboration features may be restricted. Some tools provide free manual design while charging for advanced AI generation.
Can I create an infographic from a PDF?
Some tools can process supported documents, while others require you to extract the text and paste it into a prompt. Check file limits and supported formats. Verify that the infographic accurately reflects the original document.
What is the difference between an infographic and a presentation?
An infographic usually communicates a topic through one visual composition, often on a single page or image. A presentation spreads information across multiple slides and is typically designed to support a spoken explanation.
Can I use AI infographics on my website?
Yes, provided that you review the content, have the necessary rights to the assets, and ensure the image supports the page. Use a descriptive filename and useful alt text, compress the image, and keep important information available as text when appropriate.
How do I make an infographic easier to read?
Use one main message, a clear visual hierarchy, concise text, consistent colors, and enough whitespace. Make sure labels and charts remain legible on mobile screens. Remove any element that does not help communicate the main point.
Final Verdict
The best free AI infographic makers in 2026 can help you turn information into visual content more efficiently.
For general infographic design, start with Canva. For reports and structured information, compare Piktochart, Venngage, and Visme. For charts, explore Infogram. For interactive content, consider Genially, and for text-to-diagram workflows, investigate Napkin AI. Use ChatGPT or Gemini to organize the content before designing the final visual.
Choose the tool that fits your project, confirm its free-plan limits, and verify all data before publishing. A useful infographic should be accurate, easy to read, and focused on helping the audience understand the information.
Explore more guides on AI Free Tools:
Leave a Reply