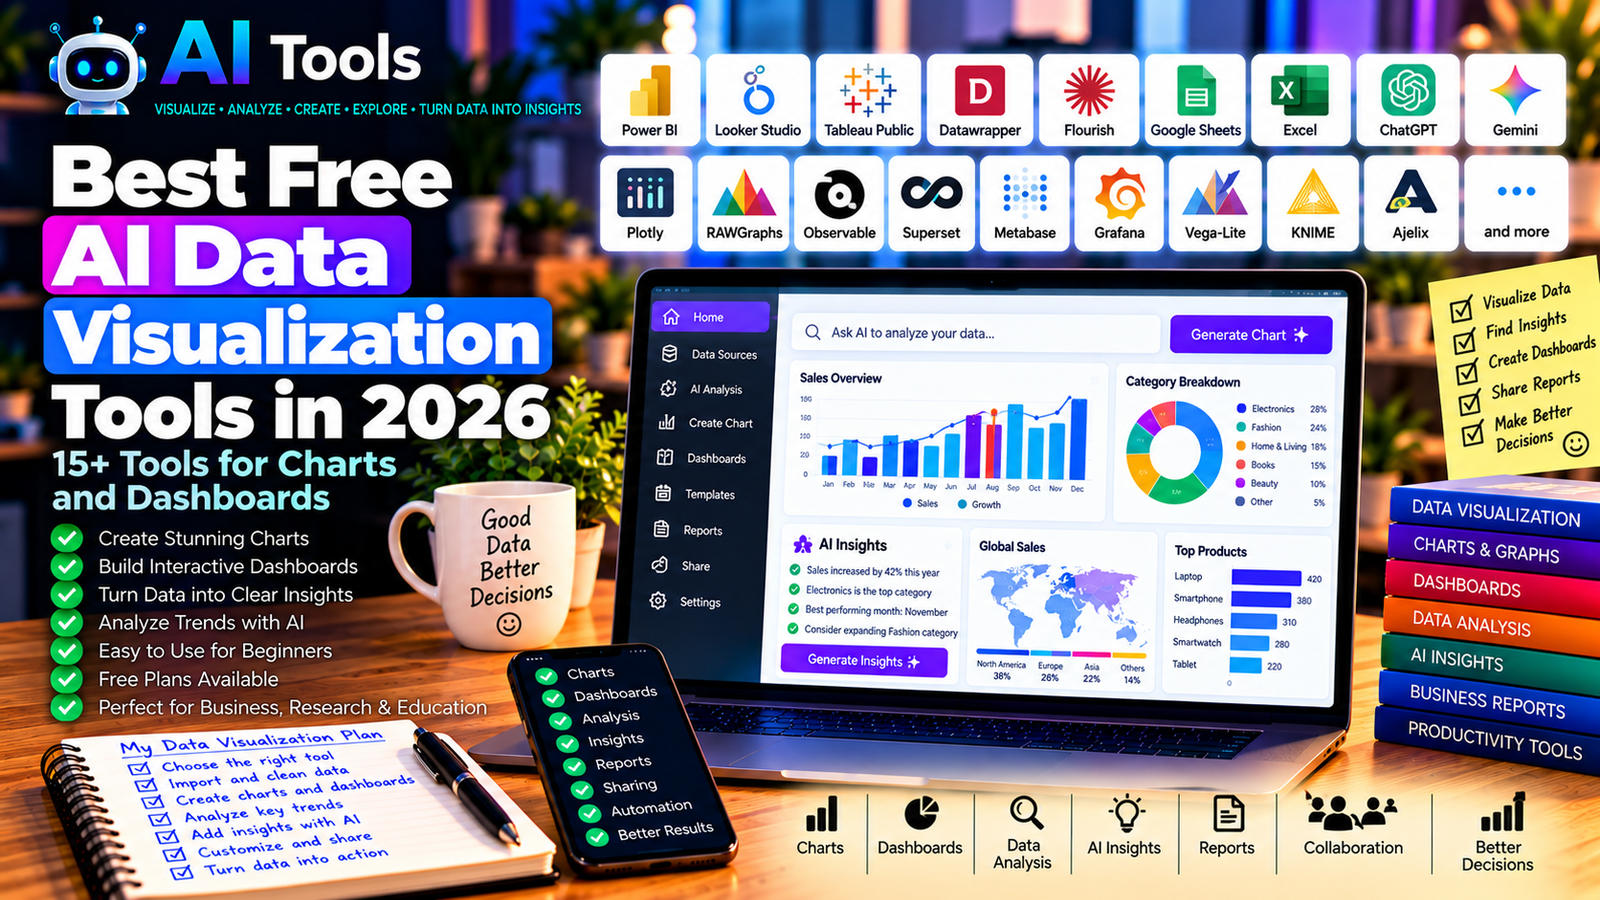
Best Free AI Data Visualization Tools in 2026: 15+ Tools for Charts and Dashboards
Data is easier to understand when it is presented visually. Instead of reading hundreds of spreadsheet rows, you can use charts, dashboards, and interactive reports to identify patterns, compare results, and communicate important information.
Free AI data visualization tools can help you move from raw data to useful visual insights. Some tools use AI to assist with analysis and chart creation, while others provide powerful free visualization features that you can combine with an AI assistant.
Whether you are a student, business owner, marketer, researcher, or data analyst, this guide will help you choose the right tools for your needs.
We compare 17 tools for creating charts, dashboards, interactive visualizations, and data reports in 2026.
Important: Not every tool listed here includes AI features in its free plan. Some are free visualization platforms that work well with AI-generated code or analysis. Free-plan limits, integrations, and AI availability can change, so check each provider’s official website before signing up.
Quick Comparison: Best Free AI Data Visualization Tools
| Tool | Best For | Free Access |
|---|---|---|
| Microsoft Power BI | Business dashboards | Free Desktop version; sharing may require payment |
| Google Looker Studio | Online reports and dashboards | Free core service |
| Tableau Public | Interactive data visualizations | Free public publishing |
| Datawrapper | Clear charts and maps | Free plan with publishing limitations |
| Flourish | Interactive stories and visualizations | Free access with publication restrictions |
| Google Sheets | Basic charts and data summaries | Free core features |
| Microsoft Excel | Charts and spreadsheet analysis | Availability depends on product and license |
| ChatGPT | Data analysis and chart assistance | Free tier with limits |
| Google Gemini | Data exploration and chart suggestions | Free tier with limits |
| Plotly | Interactive charts and dashboards | Free open-source libraries |
| RAWGraphs | Custom visualizations | Free and open source |
| Observable | Interactive data applications | Free options with plan limitations |
| Apache Superset | Business intelligence dashboards | Free and open source |
| Metabase | Business analytics dashboards | Free open-source edition |
| Grafana | Monitoring and time-series dashboards | Free open-source edition |
| Vega-Lite | Declarative data visualization | Free and open source |
| KNIME | Data preparation and visual analytics | Free open-source platform |
1. Microsoft Power BI — Best for Business Dashboards
Microsoft Power BI is a business intelligence platform that helps users transform data into interactive reports and dashboards.
It is particularly useful for companies that need to track sales, inventory, expenses, customer activity, or operational performance. You can connect data sources, create charts, and build reports that make important business metrics easier to understand.
Some Microsoft AI features can assist with data exploration and reporting, but their availability depends on your product version, license, and organization setup.
Best features:
- Create interactive charts and dashboards.
- Import data from Excel and supported sources.
- Combine multiple tables and datasets.
- Build reports with filters and drill-downs.
- Explore AI-assisted analytics where available.
Free access: Power BI Desktop offers free report-building capabilities. Sharing and collaboration features may require additional licenses or paid capacity.
Best for: Business owners, managers, analysts, and companies working with structured data.
Official website: https://powerbi.microsoft.com/
2. Google Looker Studio — Best for Online Reports
Google Looker Studio is a browser-based reporting platform for building dashboards and visual reports.
It is particularly useful for marketing and website analytics. You can use supported data sources to create reports that summarize website traffic, advertising performance, campaign results, and other business metrics.
You can also use AI assistants to help interpret the numbers and suggest which charts are appropriate for your audience.
Best features:
- Create online dashboards.
- Build charts and tables.
- Connect supported data sources.
- Share reports with other users.
- Create reports for marketing and business performance.
Free access: Core Looker Studio features are available for free. Some connectors and third-party integrations may charge fees.
Best for: Digital marketers, website owners, small businesses, and reporting teams.
Official website: https://lookerstudio.google.com/
3. Tableau Public — Best for Interactive Visualizations
Tableau Public is a platform for creating and sharing data visualizations publicly.
It is useful when you want to build an interactive chart, explore a dataset, or create a visual story that other people can view online.
The key limitation is privacy: Tableau Public is designed for public sharing. Do not upload confidential business data or private customer information.
Best features:
- Create interactive charts.
- Explore relationships between data points.
- Build visual dashboards.
- Share public visualizations.
- Learn data visualization through examples.
Free access: Tableau Public is free, but published visualizations are public. Private work and advanced enterprise features require other Tableau products or plans.
Best for: Students, data visualization learners, researchers, and public-data projects.
Official website: https://public.tableau.com/
4. Datawrapper — Best for Clear Charts and Maps
Datawrapper helps users create clean, publication-ready charts, maps, and tables without extensive programming.
It is particularly useful for journalists, bloggers, researchers, and businesses that want to communicate data clearly.
You can prepare your dataset, select a chart type, customize the appearance, and publish or export the result using the options available in your plan.
Best features:
- Create charts and tables.
- Build maps from supported geographic data.
- Customize labels and visual styles.
- Publish visualizations online.
- Produce clear graphics for reports and articles.
Free access: Datawrapper offers a free plan with limitations on certain publication and export features. Check the current terms before using it for professional publishing.
Best for: Bloggers, journalists, educators, and content creators.
Official website: https://www.datawrapper.de/
5. Flourish — Best for Interactive Data Stories
Flourish is a visualization platform that helps users turn data into interactive charts, maps, and visual stories.
It can be useful when a static chart is not enough and you want readers to explore the information themselves.
For example, a researcher could create a timeline, a business could visualize regional sales, or a blogger could build an interactive comparison using public statistics.
Best features:
- Interactive charts and maps.
- Animated visualizations.
- Data-driven storytelling.
- Customizable visual templates.
- Embedding options for supported publishing workflows.
Free access: Flourish offers free access with restrictions that can apply to publication, privacy, and advanced features.
Best for: Journalists, educators, researchers, and publishers.
Official website: https://flourish.studio/
6. Google Sheets — Best for Simple Charts and Data Summaries
Google Sheets is a free online spreadsheet tool that can turn tables into charts and basic dashboards.
Although it is not primarily an AI visualization platform, it works well alongside AI assistants. You can ask an assistant to suggest a suitable chart, explain your data, or help prepare formulas before creating a visualization in Sheets.
Best features:
- Create charts from spreadsheet data.
- Build tables and summaries.
- Use formulas and filters.
- Collaborate online.
- Share charts and spreadsheet reports.
Free access: Core features are available with a Google account. Some AI-related integrations or advanced features may require an eligible plan.
Best for: Beginners, students, freelancers, and small businesses.
Official website: https://sheets.google.com/
Related guide: Best Free AI Tools for Excel in 2026
7. Microsoft Excel — Best for Spreadsheet-Based Visualization
Microsoft Excel provides charting, tables, pivot tables, and other tools for analyzing structured data.
It can be a practical choice when your data is already stored in Excel workbooks and you want to create charts without moving to a different platform.
AI assistance can help suggest formulas, explain trends, or recommend ways to organize a report. Advanced AI integration depends on the available Microsoft product and subscription.
Best features:
- Create charts and graphs.
- Summarize data using pivot tables.
- Organize and filter datasets.
- Build spreadsheet-based reports.
- Work with AI assistants where supported.
Free access: Access depends on the Excel version and license. Web access may be available with limitations, while advanced desktop and AI features may require payment.
Best for: Office workers, accountants, managers, and business analysts.
Official website: https://www.microsoft.com/microsoft-365/excel
8. ChatGPT — Best for AI-Assisted Data Analysis
ChatGPT can help you understand datasets, identify useful questions, suggest charts, and explain patterns in data. File analysis and chart generation may be available depending on the current features and usage limits of your account.
For example, you could provide a suitable sales dataset and ask which products generate the most revenue, which months show the strongest performance, and which charts would communicate the findings clearly.
Always check calculations and conclusions against the original data.
Best features:
- Explain columns and data structures.
- Suggest appropriate chart types.
- Help summarize datasets.
- Assist with analysis and interpretation.
- Generate code for visualizations where supported.
Free plan: A free tier is available, with limits on usage, file analysis, and other features.
Best for: Beginners, analysts, students, and business owners who want help interpreting data.
Official website: https://chatgpt.com/
9. Google Gemini — Best for Exploring Data and Chart Ideas
Google Gemini can help users understand datasets, formulate analytical questions, and explore ways to visualize information.
Depending on the account and available tools, it may assist with data interpretation, formula generation, or chart planning.
It is particularly useful when you want to describe a problem in natural language before deciding how to build the final visualization.
Best features:
- Suggest analytical questions.
- Explain data patterns.
- Help plan charts and reports.
- Assist with spreadsheet-related tasks.
- Support research and interpretation.
Free access: Gemini offers free access with usage limits. File analysis and integration capabilities depend on the current account and plan.
Best for: Students, researchers, and professionals who need help exploring data.
Official website: https://gemini.google.com/
10. Plotly — Best for Interactive Charts
Plotly provides libraries and tools for building interactive visualizations. Its open-source ecosystem is particularly useful for people who want more control over the appearance and behavior of charts.
With Python, for example, you can create interactive scatter plots, line charts, maps, and dashboards from structured data.
An AI coding assistant can help you write or adapt the code, but you should still test the result and verify the underlying calculations.
Best features:
- Interactive charts.
- Support for multiple chart types.
- Python and other supported programming workflows.
- Customization of visual elements.
- Integration into data applications.
Free access: Plotly’s open-source libraries are free. Some hosted services and enterprise features may require payment.
Best for: Developers, analysts, researchers, and technically confident users.
Official website: https://plotly.com/
11. RAWGraphs — Best for Custom and Less Common Charts
RAWGraphs is an open-source visualization tool designed to help users transform data into visual representations.
It is useful when conventional bar charts and line charts are not sufficient. Depending on the data and visualization type, you can explore options such as alluvial diagrams, treemaps, and other specialized charts.
Best features:
- Create a variety of visualization types.
- Work with structured datasets.
- Map data fields to visual properties.
- Export visualizations for further editing.
- Explore less common chart formats.
Free access: RAWGraphs is free and open source.
Best for: Researchers, designers, students, and users who need specialized visualizations.
Official website: https://www.rawgraphs.io/
12. Observable — Best for Interactive Data Applications
Observable is a platform for building interactive data visualizations and data-driven applications, often using JavaScript and related visualization tools.
It offers more flexibility than many point-and-click chart builders, but it can require programming knowledge.
AI coding assistants can help you develop visualization code, explain errors, and customize interactive elements.
Best features:
- Build interactive visualizations.
- Explore data with code.
- Create reusable visual components.
- Share supported notebooks and projects.
- Develop data-driven web experiences.
Free access: Observable provides free options, but collaboration, privacy, and advanced features may vary by plan.
Best for: Developers, data journalists, and users who want custom interactive visualizations.
Official website: https://observablehq.com/
13. Apache Superset — Best for Open-Source BI Dashboards
Apache Superset is an open-source business intelligence platform for exploring data and creating dashboards.
It is suitable for users who want to connect supported databases and build charts or dashboards without relying entirely on a proprietary BI service.
However, installation and configuration can require technical knowledge and suitable infrastructure.
Best features:
- Create charts from connected data sources.
- Build dashboards.
- Explore data through supported interfaces.
- Use SQL-based analysis where appropriate.
- Customize and extend an open-source BI environment.
Free access: Apache Superset is free and open source. Hosting, infrastructure, and administration may involve costs.
Best for: Technical teams, analysts, and organizations that prefer open-source BI software.
Official website: https://superset.apache.org/
14. Metabase — Best for Accessible Business Analytics
Metabase is a business intelligence platform that helps teams explore data, create charts, and build dashboards.
It can make business data more accessible to users who do not want to write SQL for every query, although advanced tasks may still require technical skills.
It is especially useful for recurring reports and dashboards connected to business databases.
Best features:
- Create charts and dashboards.
- Explore supported databases.
- Share business metrics.
- Build reusable reports.
- Support questions and analysis through available interfaces.
Free access: Metabase offers an open-source edition. Hosted services and advanced features may require payment.
Best for: Small businesses, data teams, and organizations that need internal dashboards.
Official website: https://www.metabase.com/
15. Grafana — Best for Monitoring and Time-Series Dashboards
Grafana is a visualization platform often used to monitor systems, services, infrastructure, and time-series data.
It is not a general-purpose AI chart generator, but it is valuable when you need dashboards that update as new measurements arrive.
For example, a technical team can use Grafana to visualize server performance, application metrics, or operational data.
Best features:
- Create dashboards from supported data sources.
- Visualize time-series data.
- Monitor changing metrics.
- Configure alerts in supported setups.
- Extend functionality through integrations.
Free access: Grafana offers free open-source software. Managed cloud services and some advanced capabilities may require payment.
Best for: Developers, IT teams, engineers, and users monitoring live systems.
Official website: https://grafana.com/
16. Vega-Lite — Best for Custom Charts from Structured Data
Vega-Lite is a declarative visualization grammar that lets users describe charts through a structured specification.
Rather than manually drawing each element, you define the dataset, the fields, and the visual encoding. The system then produces the chart according to the specification.
AI coding assistants can help generate a Vega-Lite specification from a description of the chart you want.
Best features:
- Build charts from structured specifications.
- Support common chart types.
- Customize visual encodings.
- Create reproducible visualizations.
- Integrate charts into web projects.
Free access: Vega-Lite is free and open source.
Best for: Developers, technical analysts, and people building custom data applications.
Official website: https://vega.github.io/vega-lite/
17. KNIME — Best for Data Preparation and Visual Analytics
KNIME is an open-source analytics platform that helps users prepare, transform, and analyze data through visual workflows.
Before visualizing data, you often need to remove duplicates, handle missing values, combine datasets, and standardize columns. KNIME can help organize these operations into repeatable workflows.
You can then export the processed results or connect the workflow to suitable analysis and visualization steps.
Best features:
- Prepare and clean datasets.
- Combine multiple data sources.
- Build visual analytics workflows.
- Automate repeatable processing steps.
- Extend analysis using supported integrations.
Free access: KNIME offers a free open-source analytics platform. Some cloud and enterprise services may have different pricing.
Best for: Researchers, analysts, and users working with complex datasets.
Official website: https://www.knime.com/
How to Choose the Best Free AI Data Visualization Tool
The best tool depends on the type of data you have, your technical skills, and how you intend to share the results.
| Your Main Goal | Recommended Starting Tools |
|---|---|
| Create a business dashboard | Power BI |
| Report on website and marketing performance | Looker Studio |
| Publish public interactive visualizations | Tableau Public |
| Create charts for articles and reports | Datawrapper |
| Build interactive data stories | Flourish |
| Analyze data with an AI assistant | ChatGPT or Google Gemini |
| Create custom interactive charts | Plotly |
| Build open-source BI dashboards | Metabase or Apache Superset |
| Visualize monitoring data | Grafana |
| Clean data before analysis | KNIME |
Best Free AI Data Visualization Tools for Beginners
If you are new to data visualization, start with Google Sheets, Looker Studio, and ChatGPT.
Use Google Sheets to organize your data and create basic charts. Ask an AI assistant to explain the patterns you want to investigate or suggest an appropriate visualization. Then use Looker Studio if you need an online dashboard.
This approach lets you learn the basics before investing time in more advanced tools.
Best Data Visualization Tools for Small Businesses
Small businesses often need dashboards for sales, expenses, inventory, customer activity, and website performance.
Power BI is worth considering for business reporting, while Looker Studio is useful for online analytics and supported marketing data sources.
For a simple workflow, start with a clean spreadsheet, define the metrics that matter, and build a small dashboard rather than trying to track every available number.
Best Free Tools for Interactive Charts
If you want users to interact with your visualizations, consider Plotly, Flourish, Tableau Public, or Observable.
Your choice depends on whether you prefer a template-based editor or a more technical environment. Check publication and privacy settings before sharing your work.
How to Create a Data Visualization with AI in Five Steps
Step 1: Prepare Your Data
Remove unnecessary columns, check missing values, correct inconsistent formats, and make sure dates and numbers are interpreted correctly.
Step 2: Define Your Question
Decide what you want to understand. For example, are you comparing monthly sales, identifying the best-performing products, or tracking website traffic?
Step 3: Ask AI for a Chart Recommendation
You can ask an AI assistant:
“Review the structure of this dataset and recommend three appropriate charts to compare monthly sales by product category. Explain what each chart would reveal and identify any data-quality issues to check.”
Step 4: Build the Visualization
Use the recommended tool to create a chart or dashboard. Check labels, units, date ranges, filters, and the accuracy of the displayed values.
Step 5: Verify and Share
Compare the chart with the source data. Remove misleading scales, explain important limitations, and avoid publishing confidential information.
Are Free AI Data Visualization Tools Worth Using?
Yes. Free visualization tools can help students, creators, researchers, and businesses turn complex datasets into charts and reports that are easier to understand.
However, the distinction between AI analysis and ordinary visualization is important. A free charting tool may not include AI, while an AI assistant may help interpret data without providing a complete dashboard platform.
A practical approach is to combine a suitable free visualization tool with an AI assistant, then verify the results before using them for important decisions.
Frequently Asked Questions
What is the best free AI data visualization tool in 2026?
There is no single best option for every user. Power BI is useful for business dashboards, Looker Studio for online reports, and ChatGPT for AI-assisted data exploration. Your choice depends on the dataset, the required features, and the free-plan limits.
Can AI create charts automatically?
Some AI-enabled tools can recommend or generate charts from data, depending on their features and your plan. In other workflows, an AI assistant can suggest a chart type or generate code that you use in a separate visualization tool.
Which free tool is best for business dashboards?
Power BI and Looker Studio are strong starting points for many business reporting needs. Power BI is useful for structured business intelligence, while Looker Studio is convenient for online reports and supported data sources.
Can I create interactive charts for free?
Yes. Tools such as Plotly, Tableau Public, Flourish, and Observable offer ways to create interactive visualizations. Check their current publication, privacy, and usage conditions.
Do I need programming skills to use AI visualization tools?
No. Tools such as Google Sheets, Looker Studio, Datawrapper, and many Flourish templates can be used without advanced programming. Plotly, Observable, Vega-Lite, and some open-source BI platforms offer more flexibility but may require technical knowledge.
Can AI data visualization tools make mistakes?
Yes. A visualization can be misleading if the underlying data is incorrect, the chart type is unsuitable, or the axes and labels are confusing. Always check the source data and ensure that the chart represents the information accurately.
Final Verdict
The best free AI data visualization tools in 2026 help you transform raw information into charts, dashboards, and interactive reports.
For beginners, start with Google Sheets, Looker Studio, and ChatGPT. For business dashboards, consider Power BI. For interactive charts, explore Plotly, Flourish, or Tableau Public.
Choose tools based on your real needs, check the limitations of their free plans, and verify every important result before sharing it.
Explore more guides on AI Free Tools:
Leave a Reply