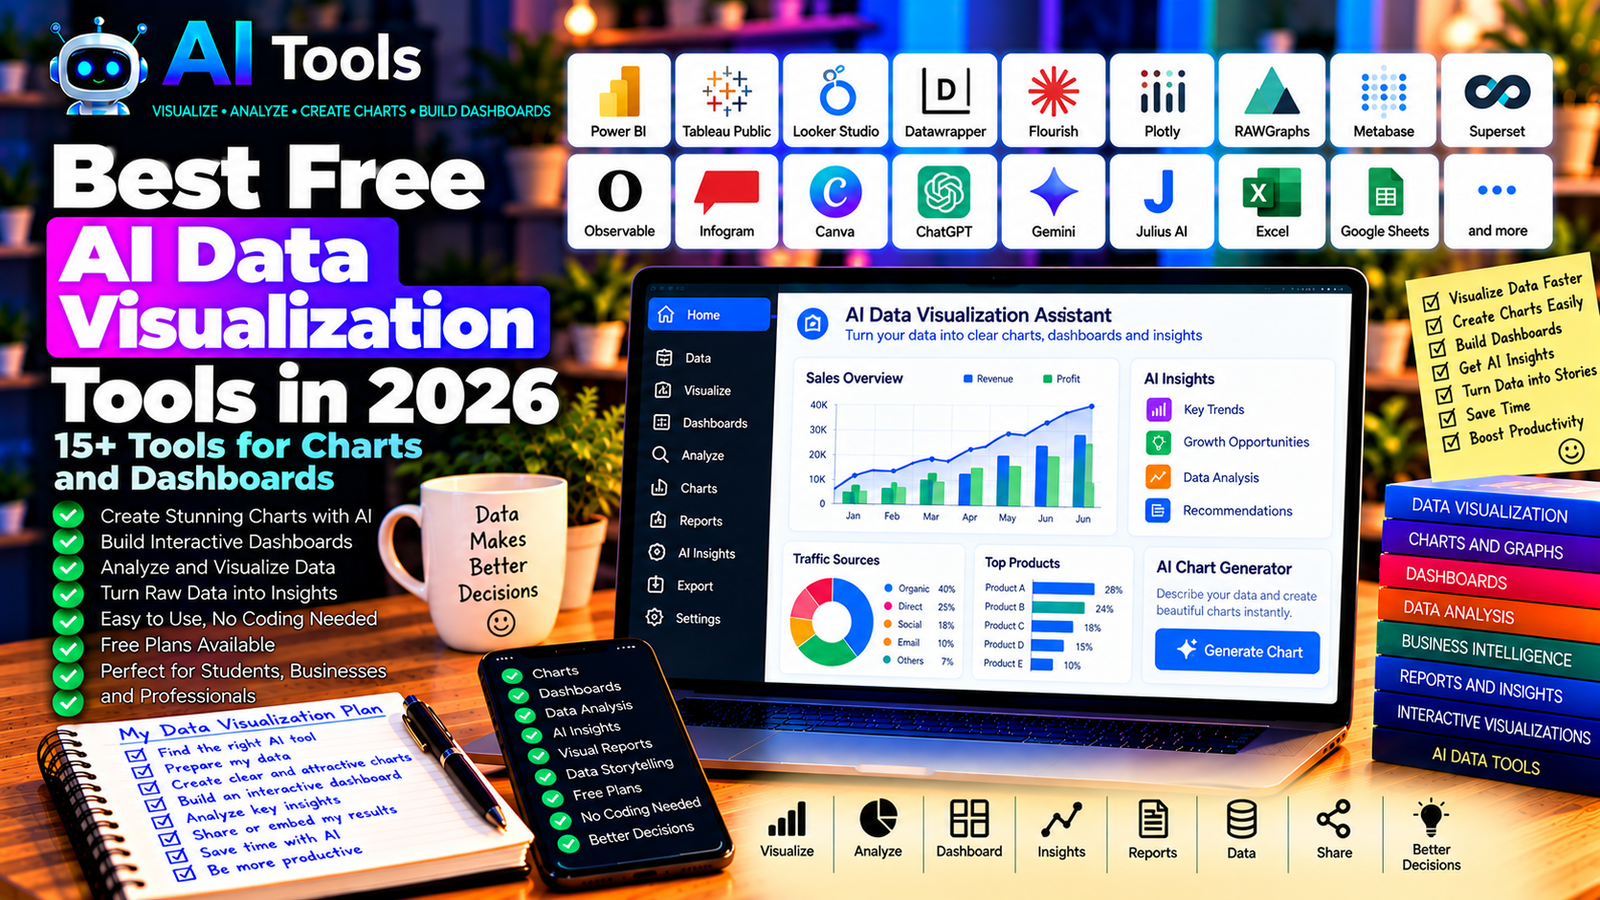
Best Free AI Data Visualization Tools in 2026: 15+ Tools for Charts and Dashboards
Data can be difficult to understand when it is presented only as rows, columns, and numbers. Charts, graphs, and dashboards make it easier to identify trends, compare results, and communicate important findings.
AI data visualization tools can simplify this process. Depending on the platform, you can describe the chart you need in plain English, upload a dataset, generate a dashboard, or use AI to explore patterns in your information.
Whether you are a business owner, student, marketer, researcher, or data analyst, the right tool can help you turn raw data into clear visual insights.
In this guide, we compare 17 data visualization platforms and AI-assisted tools in 2026. We explain their main features, free-access options, and best use cases.
Important: Not every tool listed below is an AI chart generator. Some provide free visualization software that complements AI assistants. Free plans, data limits, export options, and AI features can change, so check the official website before choosing a platform.
Quick Comparison: Best Free AI Data Visualization Tools
| Tool | Best For | Free Access |
|---|---|---|
| Google Looker Studio | Interactive business dashboards | Free core platform |
| Microsoft Power BI | Business intelligence reports | Free desktop authoring; sharing may require payment |
| Tableau Public | Public interactive visualizations | Free, with public publishing conditions |
| Datawrapper | Charts, maps, and tables | Free plan with restrictions |
| Flourish | Interactive charts and storytelling | Free access with publishing restrictions |
| Plotly | Interactive charts and data science | Open-source tools available |
| RAWGraphs | Visualizing complex datasets | Free and open source |
| Apache Superset | Business intelligence dashboards | Free and open source |
| Metabase | Interactive data dashboards | Open-source edition available |
| Observable | Interactive data visualization | Free options and paid plans |
| Infogram | Infographics and charts | Free plan with restrictions |
| Canva | Charts and visual reports | Free plan; some features are paid |
| ChatGPT | Exploring data and suggesting charts | Free tier with limits |
| Google Gemini | Data analysis and chart suggestions | Free tier; integrations vary |
| Julius AI | Conversational data analysis | Free usage may be limited |
| Excel | Charts and spreadsheet visualizations | Depends on the Excel version or account |
| Google Sheets | Collaborative charts and reports | Free core features |
1. Google Looker Studio — Best for Free Business Dashboards
Google Looker Studio is a reporting and dashboard platform that helps users transform data into interactive visual reports.
It is useful for businesses that need to monitor website traffic, advertising performance, sales, or other metrics. You can connect supported data sources and build reports that update when the underlying information changes.
Although Looker Studio is not exclusively an AI tool, it can be combined with AI assistants to analyze data and plan dashboard layouts.
Best features:
- Create interactive dashboards.
- Build charts, tables, and scorecards.
- Connect supported data sources.
- Share reports with other users.
- Monitor business and marketing performance.
Free access: Looker Studio provides a free core platform. Some connectors and third-party integrations may have separate costs.
Best for: Marketers, website owners, small businesses, and analysts.
Official website: https://lookerstudio.google.com/
2. Microsoft Power BI — Best for Business Intelligence
Microsoft Power BI is a business intelligence platform for analyzing data and creating interactive reports.
You can use it to compare monthly revenue, monitor inventory, evaluate expenses, and identify changes in business performance. AI-related features depend on the product, license, and configuration.
Power BI is particularly useful when your data already exists in Excel or other supported business systems.
Best features:
- Create interactive reports and dashboards.
- Connect multiple data sources.
- Transform data for analysis.
- Build charts and business performance indicators.
- Explore eligible AI-assisted analytics.
Free access: Power BI Desktop offers free report-building capabilities. Publishing, collaboration, sharing, and some advanced AI features may require paid licensing.
Best for: Business owners, analysts, accountants, and management teams.
Official website: https://powerbi.microsoft.com/
3. Tableau Public — Best for Interactive Data Stories
Tableau Public allows users to create and publish interactive data visualizations. It is popular among people who want to explore datasets and communicate findings through charts and dashboards.
It is not primarily an AI generator, but you can use a separate AI assistant to help prepare data, choose appropriate chart types, or write analytical explanations.
Best features:
- Build interactive charts and dashboards.
- Explore relationships between variables.
- Create visual data stories.
- Publish visualizations publicly.
- Learn from examples created by other users.
Free access: Tableau Public is free, but published visualizations are public. Do not use it for confidential business information.
Best for: Students, researchers, data enthusiasts, and public-data projects.
Official website: https://public.tableau.com/
4. Datawrapper — Best for Charts, Maps, and Tables
Datawrapper is a visualization platform designed to help users create clear charts, maps, and tables.
It is particularly useful for reports, articles, research publications, and presentations where readability matters more than complicated dashboard functionality.
Best features:
- Create bar, line, and other chart types.
- Build maps and data tables.
- Customize labels and colors.
- Prepare visualizations for online publication.
- Export or embed visualizations according to plan.
Free access: Datawrapper offers free access with restrictions that may apply to publishing, exports, or other features.
Best for: Journalists, researchers, bloggers, educators, and content creators.
Official website: https://www.datawrapper.de/
5. Flourish — Best for Interactive Visual Storytelling
Flourish helps users create interactive charts, maps, and visual stories without requiring extensive programming knowledge.
It can be useful for presenting research findings, explaining market trends, and turning a dataset into an engaging visual experience.
Best features:
- Create interactive charts and maps.
- Use visualization templates.
- Build visual stories.
- Customize presentation and layout.
- Publish or embed supported visualizations.
Free access: Flourish has offered a free plan, but publishing, privacy, and advanced features may be restricted.
Best for: Educators, journalists, researchers, and content creators.
Official website: https://flourish.studio/
6. Plotly — Best for Interactive Charts and Data Science
Plotly provides tools for creating interactive visualizations. Its open-source libraries support chart creation in programming environments such as Python.
You can use Plotly to create scatter plots, line charts, bar charts, heatmaps, and more advanced visualizations. An AI assistant can help write the code needed to generate a chart from your data.
Best features:
- Build interactive charts.
- Visualize scientific and business data.
- Create charts using supported programming libraries.
- Customize chart appearance and interactions.
- Integrate visualizations into analytical applications.
Free access: Plotly’s open-source libraries are free to use. Commercial hosting and certain platform features may have separate pricing.
Best for: Data analysts, researchers, developers, and technical users.
Official website: https://plotly.com/
7. RAWGraphs — Best for Unusual and Complex Charts
RAWGraphs is an open-source data visualization tool that helps users create a wide range of visual representations from structured datasets.
It is especially useful when a conventional bar chart or line graph is not enough to communicate the relationships in your data.
Best features:
- Create different types of visualizations.
- Import structured data.
- Map data columns to visual properties.
- Experiment with specialized chart types.
- Export supported visualizations.
Free access: RAWGraphs is free and open source.
Best for: Researchers, designers, students, and users exploring complex datasets.
Official website: https://www.rawgraphs.io/
8. Apache Superset — Best for Open-Source Dashboards
Apache Superset is an open-source business intelligence platform for exploring data and building dashboards.
It can be suitable for organizations that want to create visual reports from supported databases without depending entirely on a proprietary dashboard platform.
It generally requires more technical setup than beginner-oriented tools.
Best features:
- Create interactive dashboards.
- Explore connected datasets.
- Build charts using supported visualizations.
- Filter and compare data.
- Connect supported database systems.
Free access: Apache Superset is open source. Hosting, infrastructure, maintenance, and technical support may incur costs.
Best for: Technical teams, analysts, developers, and organizations managing their own data infrastructure.
Official website: https://superset.apache.org/
9. Metabase — Best for Accessible Business Dashboards
Metabase is a business intelligence platform that helps users explore data and create charts and dashboards.
Depending on the data source and configuration, users can investigate business questions, compare results, and share reports with colleagues.
Best features:
- Build dashboards from connected data.
- Create charts and tables.
- Explore datasets using supported query tools.
- Share reports with authorized users.
- Connect supported databases.
Free access: Metabase offers an open-source edition. Managed hosting and additional enterprise capabilities may require payment.
Best for: Small businesses, analysts, startups, and technical teams.
Official website: https://www.metabase.com/
10. Observable — Best for Custom Interactive Visualizations
Observable provides a development environment for building interactive data visualizations and data-driven applications.
It can be useful when you want to customize a visualization beyond the standard templates offered by basic chart tools.
An AI coding assistant can help generate or explain the JavaScript code used in supported visualization workflows.
Best features:
- Create interactive visualizations.
- Work with data using JavaScript.
- Build custom charts and visual explanations.
- Explore reusable examples and notebooks.
- Share supported projects.
Free access: Observable has offered free access and paid plans. Check current collaboration, privacy, and publishing limits.
Best for: Developers, data journalists, analysts, and technically confident creators.
Official website: https://observablehq.com/
11. Infogram — Best for Infographics and Visual Reports
Infogram focuses on charts, infographics, maps, and visual reports.
It is useful when you need to present data in a format that is easy to understand, especially for marketing materials, reports, and educational content.
Best features:
- Create charts and infographics.
- Build visual reports.
- Use templates and design elements.
- Present statistics in an accessible format.
- Share or publish supported visualizations.
Free access: Infogram offers free access with restrictions. Advanced exports, branding options, and additional features may require payment.
Best for: Marketers, educators, content creators, and business teams.
Official website: https://infogram.com/
12. Canva — Best for Attractive Charts and Presentations
Canva is a visual design platform that can help users turn data into charts, infographics, and presentation slides.
It is particularly useful when the goal is to communicate results clearly through a visually appealing report rather than build a complex analytical dashboard.
Best features:
- Create charts and visual reports.
- Add charts to presentations and infographics.
- Customize colors, labels, and layouts.
- Combine data visualizations with text and graphics.
- Use eligible AI design features.
Free access: Canva offers a free plan. Some premium assets, advanced features, and AI capabilities require payment or have usage limits.
Best for: Students, marketers, small businesses, and content creators.
Official website: https://www.canva.com/
13. ChatGPT — Best for AI-Assisted Data Exploration
ChatGPT can help users understand datasets, identify possible trends, suggest visualizations, and explain analytical results. Depending on current capabilities and usage limits, it may also analyze supported uploaded files.
For example, you can provide a table of monthly sales and ask which chart would best compare performance across products.
Best features:
- Explain what different chart types communicate.
- Help analyze supported datasets.
- Suggest calculations and comparisons.
- Generate code for visualizations.
- Help interpret patterns and potential anomalies.
Free access: ChatGPT offers a free tier with usage and feature limits. File analysis and advanced tools may be restricted.
Best for: Students, small business owners, analysts, and people who need help understanding data.
Official website: https://chatgpt.com/
14. Google Gemini — Best for Data Questions and Chart Ideas
Google Gemini can help users interpret supported information, suggest chart types, explain calculations, and develop ideas for visual reports.
It can be useful alongside Google Sheets, although integrated features depend on the account and eligible plan.
Best features:
- Suggest charts for different datasets.
- Explain numerical patterns.
- Help organize data for visualization.
- Generate analytical questions.
- Support eligible Google productivity workflows.
Free access: Gemini offers a free tier with limits. Advanced features and integrations vary by account and subscription.
Best for: Google Sheets users, students, marketers, and professionals.
Official website: https://gemini.google.com/
15. Julius AI — Best for Conversational Data Visualization
Julius AI is designed to help users analyze data through natural-language questions and supported file uploads.
Rather than manually building every calculation, you can ask questions about a dataset and explore suitable charts or summaries.
Best features to investigate:
- Analyze supported datasets.
- Ask questions about data in plain language.
- Generate charts and visual summaries.
- Explore trends and potential outliers.
- Support data-analysis workflows.
Free access: Usage limits, file support, and available features may change. Check the current plan before uploading large datasets.
Best for: Students, researchers, analysts, and professionals who prefer conversational analysis.
Official website: https://julius.ai/
16. Microsoft Excel — Best for Everyday Charts and Reports
Excel includes spreadsheet and charting features that can be used to create visual reports from structured data.
You can generate charts, format tables, build pivot tables in supported versions, and use formulas to prepare data for analysis. AI assistance may help you choose chart types, write formulas, or interpret results.
Best features:
- Create bar, line, pie, and other charts.
- Build tables and pivot tables in supported versions.
- Use formulas to prepare data.
- Combine charts with spreadsheet reports.
- Work with eligible AI features where available.
Free access: Access depends on the Excel version, platform, and account. Some web features may be available free, while desktop and advanced AI features may require a paid plan.
Best for: Businesses, accountants, students, and office workers.
Official website: https://www.microsoft.com/microsoft-365/excel
17. Google Sheets — Best for Free Collaborative Charts
Google Sheets is an online spreadsheet application with charting and collaboration features.
You can create graphs from tabular data, share reports with colleagues, and update visualizations as the underlying data changes. AI assistance can help you prepare formulas, interpret data, or decide which chart to use.
Best features:
- Create charts from spreadsheet data.
- Collaborate in real time.
- Build tables and formulas.
- Share reports online.
- Use eligible AI integrations where available.
Free access: Core Google Sheets features are available free with a Google account. Some AI-assisted features depend on the account and plan.
Best for: Students, freelancers, small businesses, and teams that collaborate online.
Official website: https://sheets.google.com/
How to Choose the Best Free AI Data Visualization Tool
The right platform depends on the complexity of your data and the final result you need.
| Your Main Goal | Recommended Starting Tools |
|---|---|
| Create a business dashboard | Looker Studio or Power BI |
| Publish interactive charts publicly | Tableau Public or Flourish |
| Make charts for articles and reports | Datawrapper |
| Design attractive infographics | Canva or Infogram |
| Explore data with natural-language questions | ChatGPT or Julius AI |
| Create custom interactive charts | Plotly or Observable |
| Build an open-source analytics dashboard | Metabase or Apache Superset |
| Create simple charts from spreadsheets | Excel or Google Sheets |
Best Free AI Data Visualization Tools for Small Businesses
Small businesses often need to monitor sales, costs, inventory, website traffic, and marketing results.
Looker Studio is a useful starting point for interactive reports, while Google Sheets and Excel are practical for simpler datasets. Power BI becomes attractive when you need more advanced business intelligence.
Before choosing a tool, consider where your data is stored, how often it changes, and whether multiple people need access to the dashboard.
Best AI Tools for Data Visualization in Marketing
Marketers can use charts and dashboards to compare campaign performance, traffic sources, conversion rates, and content results.
Looker Studio is worth considering for marketing reports. Datawrapper and Canva can help prepare charts for articles, presentations, and social media.
AI assistants can help interpret the numbers, but always distinguish correlation from causation and check that your comparisons use consistent date ranges and definitions.
Best Free Tools for Students and Researchers
Students can use Google Sheets, RAWGraphs, Datawrapper, or Plotly depending on the assignment and their technical skills.
For a straightforward chart, a spreadsheet is often enough. For a more specialized visualization, RAWGraphs or Plotly may offer greater flexibility.
Always cite the original data source and label charts accurately.
How to Create a Data Visualization with AI in Five Steps
Step 1: Prepare Your Dataset
Organize the information into clear columns and rows. Use meaningful column names, consistent date formats, and appropriate numerical values.
Remove unnecessary personal information before uploading the dataset to an external AI service.
Step 2: Define the Question
Decide what you want the chart to explain. Examples include:
- Which product generated the most revenue?
- How did sales change from one month to another?
- Which marketing channel brought the most visitors?
- How does inventory vary across product categories?
Step 3: Ask AI for a Suitable Chart
Try this prompt:
“Analyze this dataset and recommend the best chart to compare monthly sales across five product categories. Explain why the chart is suitable, identify any missing values that could affect the result, and suggest clear axis labels. Do not invent data or claim trends that the dataset does not support.”
Step 4: Create the Chart
Use the recommended tool to build the chart. Adjust the title, labels, scale, colors, and legend so the result is easy to understand.
Step 5: Verify the Results
Compare the visualization with the original data. Check totals, dates, units, missing values, and the scale of the axes. Make sure the chart does not exaggerate differences or hide important information.
Are Free AI Data Visualization Tools Worth Using?
Yes. They can reduce the time required to prepare charts, explore datasets, and build reports.
However, the most useful workflow often combines AI with a reliable visualization platform. AI can help interpret a question and suggest an appropriate chart, while a dedicated tool produces the visualization and allows you to inspect the underlying data.
For many beginners, Google Sheets or Excel combined with a general AI assistant is enough. Businesses that need recurring dashboards can explore Looker Studio or Power BI.
Are AI Data Visualization Tools Accurate?
AI can misinterpret data, overlook missing values, select an unsuitable chart, or produce an incorrect explanation of a trend.
To improve reliability:
- Verify calculations against the original data.
- Check dates, units, and category labels.
- Review missing values and duplicates.
- Use suitable chart scales.
- Avoid presenting a correlation as proof of causation.
- Keep a copy of the original dataset.
For financial, scientific, or business-critical reports, validate the analysis before making decisions.
Frequently Asked Questions
What is the best free AI data visualization tool in 2026?
Looker Studio is a strong starting point for free business dashboards. Datawrapper is useful for clear charts, Tableau Public for interactive public visualizations, and ChatGPT or Julius AI for conversational data exploration.
Can AI create charts automatically from Excel data?
Some AI assistants can analyze supported spreadsheet files and suggest or generate charts. You can also use Excel’s built-in charting features with AI-generated instructions. Available automation depends on the tool and plan.
Are there completely free data visualization tools?
Yes. Examples include RAWGraphs, open-source Plotly libraries, and the open-source editions of platforms such as Metabase. Free hosting, collaboration, or enterprise features may still involve costs.
Which tool is best for interactive dashboards?
Looker Studio and Power BI are useful starting points for business dashboards. Metabase and Apache Superset are alternatives for teams that can manage their own data infrastructure.
Can I use AI to create charts without coding?
Yes. Some conversational AI tools can help interpret data and generate visualizations through supported workflows. Looker Studio, Canva, Datawrapper, and spreadsheet applications also provide visual interfaces that do not require programming for common charts.
Is Tableau Public suitable for confidential company data?
No. Tableau Public is intended for publicly shared visualizations. Do not publish confidential business, customer, or financial information there.
How can I make my charts more professional?
Use a clear title, descriptive labels, consistent units, readable colors, and an appropriate chart type. Remove unnecessary decoration and make sure the visualization accurately represents the data.
Final Verdict
The best free AI data visualization tools in 2026 can help turn spreadsheets and raw datasets into charts, dashboards, and visual reports.
For business dashboards, start with Looker Studio or Power BI. For charts that can be published in articles and reports, explore Datawrapper or Flourish. For AI-assisted analysis, try ChatGPT or Julius AI, and use Excel or Google Sheets for straightforward spreadsheet charts.
Choose a tool based on your data, desired output, and privacy requirements. Verify the numbers before sharing or acting on the results.
Explore more guides on AI Free Tools:
Leave a Reply